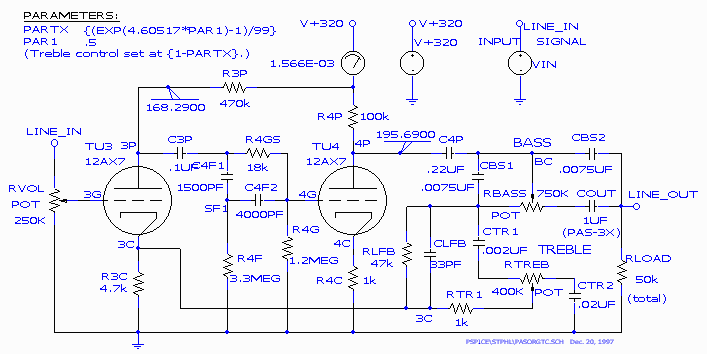
Figure 1. The original PAS line amplifier.
Feedback and fidelity part 1
by Norman Koren
Updated August 18, 2001 Negative feedback can be a wonderful thing when done well,but it's often done badly. Here's how to use it properly.
In his January 1998 Stereophile article "A Future Without Feedback ," Martin Colloms asserts that "measurements do not fully describe sound quality," and goes on to suggest that "corrective feedback is fundamentally unmusical." He poses the question, "has anyone explored the implications of negative feedback for reproduced sound quality in the absolute sense?" What follows is the results of such an exploration. We shall describe new measurements that provide improved insight into the origins of audio quality, and we shall use these measurements to determine when and where to apply feedback to best advantage. Although we will use vacuum tube circuits as examples, all observations apply equally well to solid-state. We shall also revisit traditional measurements. One of them— harmonic distortion at rated power output— has an unexpected correlation with sound quality.
Sometimes it seems that so much has been written about feedback’s harmful effects that it’s easy to forget its benefits. Why do engineers love it? Improved frequency response, reduced harmonic distortion, better gain control, increased input impedance (in many circuits), and decreased output impedance (in circuits with voltage feedback). So why do audiophiles hate it? Harsh, gritty, grainy, glaring sound. Reason enough.
Now for the BIG question: Are these qualities intrinsic to negative feedback or do they arise from its improper application? From my experience it’s mostly the latter. Mostly. There are a few places where feedback runs into unavoidable problems, and it shouldn’t be a big surprise that one of them is the single-ended vacuum tube power amplifier. How can we know this? We have an instrument for looking deep into the heart of amplifiers— an instrument that may be within your reach this very moment.
SPICE is widely used in industry to prove integrated circuit designs before they are cast in silicon, where fixing errors is far more costly than in concrete. There are several commercial versions of SPICE, all of which start with the Berkeley algorithms and add user-friendly front-ends and outputs. Probably the best-known of them is PSpice from Cadence Design Systems (http://www.orcad.com/Product/Analog/analog.asp). A free evaluation version that can simulate up to fifty parts is available on CD ROM or can be downloaded from the web. Fifty parts won’t get you far with semiconductors, but it’s sufficient for the design of surprisingly sophisticated vacuum tube circuits. Full versions of PSpice are very expensive. Another excellent program is Electronics Workbench from Interactive Image Technologies (1-800-263-5552; http://www.interactiv.com), which comes in a $299 package (sometimes on sale) that can do some serious simulation. Each of these programs has its learning curve, and since I’ve taken the trouble to learn PSpice, I’m stuck with it. I love it.
I’m not the only one who values SPICE. When I escaped from Silicon Valley in 1985, I had a neighbor who was developing a version (HSpice) in his garage. While I was tinkering with tubes, he was quietly taking over the market for large-scale integrated circuit simulation. In August 1997 I read that he had sold his company— Meta Software— for one hundred and sixty million dollars. (That was before the dot com boom, when hardware still got some respect.) Can there be a lesson here? I suppose we tube lovers must be content to receive our reward in heavenly sound. None of us will become another Bill Gates. Besides, the only reproduced sound he ever hears is digital.
Many readers may wonder how well digital simulation can unlock the secrets of analog electronics. In my experience it can do so astonishingly well. I never cease to be amazed by how closely measurements match SPICE simulations.
What is wrong with conventional measurements? Two things. The first is that most of them are made in frequency domain. The real world happens in time domain. Frequency domain measurements are derived from a mathematical construct called the Fourier transform, which is defined for linear systems. When a system becomes seriously nonlinear— as an amplifier does when it saturates— frequency domain measurements their meaning. Time domain measurements, such as pictures of clipped sine waves, are needed to tell the real story. The one time domain measurement frequently seen in equipment reviews is the 10kHz square wave. This measurement is usually made with a small signal— far from saturation— and provides the same information as the frequency response curve. SPICE produces output in both time and frequency domain.
The second problem is that conventional measurements are taken only at an amplifier’s external connections: A signal is fed into the input terminals and measured at the output terminals. What happens inside the circuit can make the difference between sonic mediocrity and distinction. With SPICE, you can probe deep inside of circuits. I’ve made measurements that would be difficult, expensive, and time-consuming with hardware instruments; measurements rarely if ever seen in equipment reviews; measurements that correlate much more closely with sound quality than such old standbys as harmonic distortion and frequency response. We’ve known for a long time they didn’t hold the secrets.
A program’s performance is only as good as its models— sets of equations that simulate device behavior— and SPICE does not have built-in models for vacuum tubes. External models must be added. For many years tubes were modeled by the Langmuir-Childs law [1,2], which represents a tube as a voltage-controlled current source whose current is proportional to the three-halves power of the voltage on the controlling elements. This model approximates tube performance fairly well in the middle of the operating range, but fails miserably near cutoff, a region particularly critical to the performance of class AB push-pull amplifiers. It works well for calculating frequency response but not for distortion.
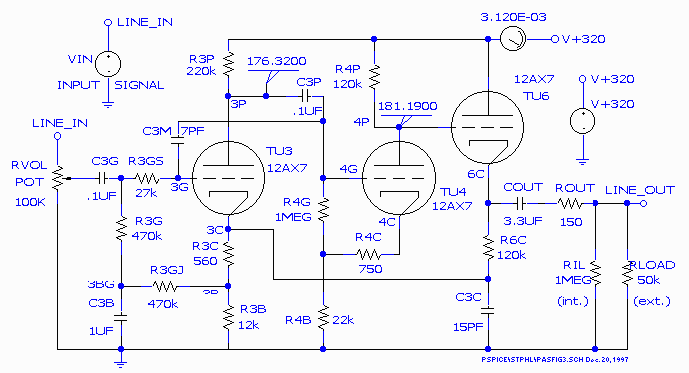
A new set of models, accurate enough to match experimental tube behavior in all critical regions, has recently been published [3] and applied to the design of a modified Dynaco PAS preamplifier [4] with stunning sonic results. We shall use the old and new PAS line amplifiers (figures 1 and 2) as examples of problems and solutions related to feedback.
To you non-technical readers, I offer an apology. Feedback cannot be discussed intelligently without getting somewhat technical. I shall try to keep this exposition as readable as possible— There will be no heavy formulas, and you may safely skip over circuit descriptions and references to resistors and capacitors.
Before we proceed, a few definitions are needed: There are two types of negative feedback, or degenerative feedback as it is sometimes called: local and global. Local feedback is connected within or around a single gain stage; global feedback is connected around several gain stages, usually from the amplifier’s output to its input. Local feedback is generally regarded as benign, and with this view I concur. The amount of feedback, expressed in decibels (dB), is the ratio of the gains without and with feedback (the open and closed-loop gains): 6dB is a factor of 2 in voltage (4 in power); 20dB is a factor of 10 in voltage (100 in power), etc.
To make matters worse, capacitance in shunt with the load increases the phase shift. Interconnect cables have around 20pF per foot, and electrostatic loudspeakers are nothing more than big honking capacitors-- as large as 2 microfarads-- that know how to move. So load capacitance is always present. An amplifier that performs nicely with a purely resistive load (widely used in equipment reviews) may misbehave in the real world. Amplifiers have a property called phase margin— the difference between the maximum phase shift and 180 degrees— that indicates how well they can tolerate capacitive loads. A qualitative estimate of phase margin may be obtained by measuring the response with capacitance in shunt with the load. This is particularly easy with SPICE.
To keep phase shift under control, a single RC network must dominate the rolloff. For global feedback loops, this usually involves adding a capacitor to the circuit. This is accomplished in the original PAS line amplifier (fig. 1) with 33pF capacitor CLFB connected in parallel with feedback resistor RLFB, and in the new design (fig. 2), with 7pF capacitor C3M in the input circuit. Although these capacitors reduce the high frequency cutoff (-3dB point), it is still around 100kHz in both circuits— well beyond the limits of human hearing. Most well-designed preamplifiers achieve good frequency response and stability at the same time— but this is not always the case for power amplifiers with output transformers.

The line amplifier of fig. 2 differs in just one respect from the previously published version [4]: the addition of 150 ohm resistor ROUT in series with the output. I had always objected to such a resistor because it increases the output impedance, worsening the high frequency rolloff in the presence of shunt capacitance from cables. But with negative feedback, phase shift due to shunt capacitance boosts the high frequency response up to the resonant peak, just over 100kHz. In extreme cases, this can even result in oscillation. Increasing the compensation capacitor fixes this problem at the expense of high frequency rolloff for short cables with low capacitance. ROUT solves the problem by isolating the amplifier from the load capacitance. If the correct value is chosen (easily done by trial-and-error with SPICE), the high frequency loss due to the increased output impedance will balance the boost due to feedback, making the response below the resonant peak nearly independent of the load capacitance— even for cables as long as 100 meters. This neat little trick cannot be accomplished without negative feedback.
If we observe the response of the original PAS line amplifier (fig. 3; simulated with Evaluation PSpice 6.3, which tolerates more components than the newer evaluation versions), we find that the output signal is fairly flat to below 1Hz, but the signal at the plate of the first gain stage plate (node 3P) has a huge resonant peak at 0.4Hz— 35dB above the mid-frequency level. This peak is present because there is no feedback at dc: It is blocked from reaching the output terminal by coupling capacitor C4P.
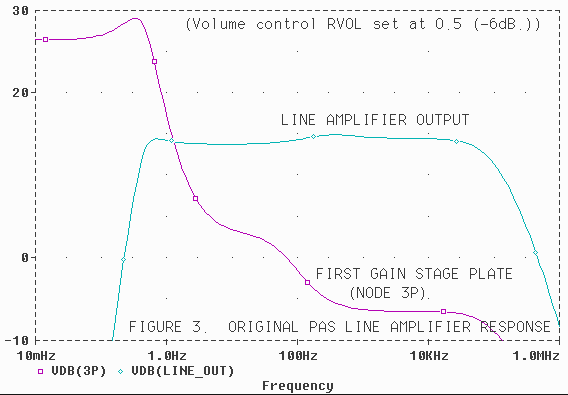
Now you might ask what effect a resonant peak far below the limits of human hearing and loudspeakers— a peak that doesn’t even appear at the preamplifier output— can have on sound quality. Quite a lot, it turns out. To begin with, 33 RPM turntables rotate at a frequency close to 0.4Hz. Signals from mechanical perturbations at this frequency will be greatly exaggerated inside the preamplifier. Then there is tube-generated 1/f noise, also called flicker or pink noise— noise whose power spectral density is inversely proportional to frequency (f). 1/f noise can be very significant at 0.4Hz. These two noise sources perturb the bias levels of tubes inside the preamplifier. Since the tubes aren’t perfectly linear, this leads to envelope modulation— small variations in signal amplitude at the output that muddy the sound and blur the imaging.
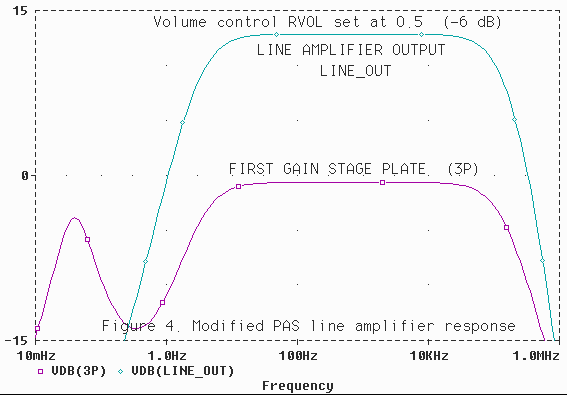
This problem has been solved in the modified PAS line amplifier (fig. 2) with a dc-coupled negative feedback loop: Cathode resistor R6C of the cathode-follower also functions as the feedback resistor. It took quite a bit of trial-and-error with SPICE to get the input tube operating current to the correct level (0.7mA; much higher than the original). A resonant peak (fig. 4) is still present in the new circuit, but it is now 3dB below the mid-frequency signal level— 38dB better than the original. This is a perfect example of how external measurements can be misleading: The original design has much more extended low frequency response, but the new design has cleaner bass and better overall sound.
Van der Veen defines the quality factor of an output transformer as the ratio of shunt to leakage inductance, QF = LP/LSP. QFis roughly proportional to the ratio of the upper to lower cutoff frequencies. Leakage inductance LSP arises from imperfect coupling between the primary and secondary windings, and is a strong function of the type of transformer. There are three broad categories:
For this reason, feedback cannot be used to extend the frequency response of an amplifier with an output transformer. Sad to say, not all tube amplifiers apply feedback correctly. Frequency response peaks above 20kHz and ringing in response to 10kHz square waves have appeared in several Stereophile equipment reviews, even for some extremely expensive amplifiers. Such amplifiers can misbehave badly if there is much capacitance in the load.
Feedback is particularly touchy in single-ended circuits because the output transformer cutoff frequency is so close to the top of the audible range. A feedback loop must be compensated with extreme care: Too much compensation rolls off the highs very audibly; too little risks a response peak. Even just the right balance may have poor phase margin: It might sound wonderful with one speaker-cable combination but poor with others. This is one of two reasons that SE amplifiers are poorly suited for feedback. The other— hardened clipping— will be discussed below.
I am convinced that RF interference is a major culprit because every circuit change I’ve ever made to reduce the RF entering an amplifier has improved the sound— made it sweeter, smoother, cleaner, and more generally listenable. It is the apparent cause of the grittiness, graininess, harshness, and listener fatigue — what Martin Colloms calls "sand in the tweeter" — that can plague amplifiers with otherwise excellent specifications. The sonic degradation caused by RF interference is far worse than harmonic distortion.
RF interference comes from a wide variety of sources: radio, TV, digital cellular phones, microwave ovens, lamp dimmers, flourescent lights, and digital appliances such as computers and CD players. (It is particularly difficult to eliminate inside CD players, where it may be as responsible as jitter for "digititis.") It is virtually omnipresent in urban, suburban, and all but the most remote rural areas. It varies from time-to-time and place-to-place, and may be responsible for many of the discrepancies in published amplifier reviews.
The exact mechanism by which RF interference degrades audio quality is not well-understood. The most likely cause is intermodulation distortion. Paul Miller [6] described a series of experiments in which he inserted strong RF signals modulated with random audio noise into several amplifiers and measured the resulting audio noise spectra (the result of intermodulation). He claimed to find a strong correlation with the subjective sound quality.
There is a very simple test for determining if an amplifier is overly sensitive to RF interference: Turn the volume up and listen for a pop when you turn on a nearby appliance. A well-designed amplifier will remain silent.
The RF problem was solved in the modified PAS line amplifier (fig. 2) by compensating the feedback loop with an RC network in the input stage— R3GS and C3M. Due to the Miller effect, the effective capacitance C3M is its intrinsic capacitance (7pF) multiplied by the gain of tube TU3 after feedback is applied (not its intrinsic gain). Calculating this gain can be tricky: Global feedback reduces the gain of the first stage only; all others operate at full gain. SPICE eliminates the need for tricky calculations. The correct value of C3M can be quickly determined by trial-and-error. This technique, which we shall call Miller compensation, has poorer high frequency response than the traditional technique, but the response can be extended— made as good as the traditional technique without compromising stability— by adding shunt capacitor C3C to the input stage cathode circuit. C3C also provides a bit of extra RF suppression.
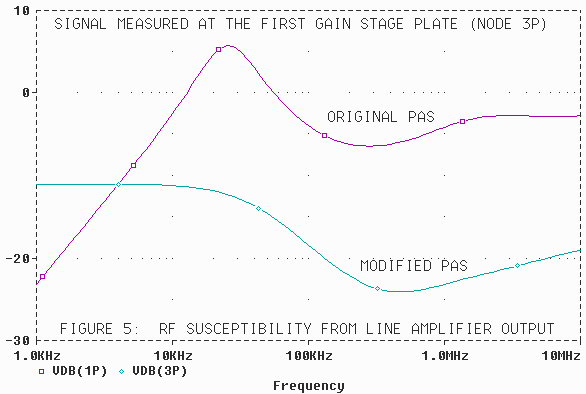
The improvement brought about by this technique is illustrated in fig. 5, which shows the signal on the plate of the first gain stage (node 3P) when input signal VIN is applied to the line amplifier output terminal, LINE_OUT. In the critical region above 20kHz, the response of the modified amplifier averages 18dB below that of the original. The actual improvement is even greater because, with VIN applied to the line amplifier input, the signal at node 3P (figures 3, 4) is 6dB larger in the modified line amplifier. This is so because local current feedback decreases the gain of the second stage (TU4), allowing the first stage to operate at increased gain. The signal-to RF noise ratio of the modified amplifier is therefore 24dB better than the original— a really significant improvement.
The Parts Connection Catalog & Resource Guide (1-800-769-0747; http://www.sonicfrontiers.com/tpc) contains an excellent collection of schematic diagrams of classic tube preamplifiers and power amplifiers. Nearly every amplifier with feedback— and that’s almost all of them— uses the traditional compensation technique with the capacitor in parallel with the feedback resistor. In all fairness, this technique is easy to apply and provides good stability with minimum frequency response loss. The new technique, Miller compensation in the input stage, requires two capacitors (C3M and C3C in fig. 2) to achieve good frequency response extension. With the proper component values, difficult to obtain without SPICE, the new technique has improved stability, i.e., less of a response peak with capacitance in shunt with the load. Compensating a feedback loop at the input stage also reduces response peaks at intermediate gain stages that can occasionally cause such problems as unexpected saturation.
In part 2 we discuss feedback in power amplifiers.
| This page was created December 8, 2003 |
Images and text copyright (C) 2000-2012 by Norman Koren. Norman Koren lives in Boulder, Colorado. Since 2003 most of his time has been devoted to the development of Imatest. He has been involved with photography since 1964. Designing vacuum tube audio amplifiers was his passion between about 1990 to 1998. |  |